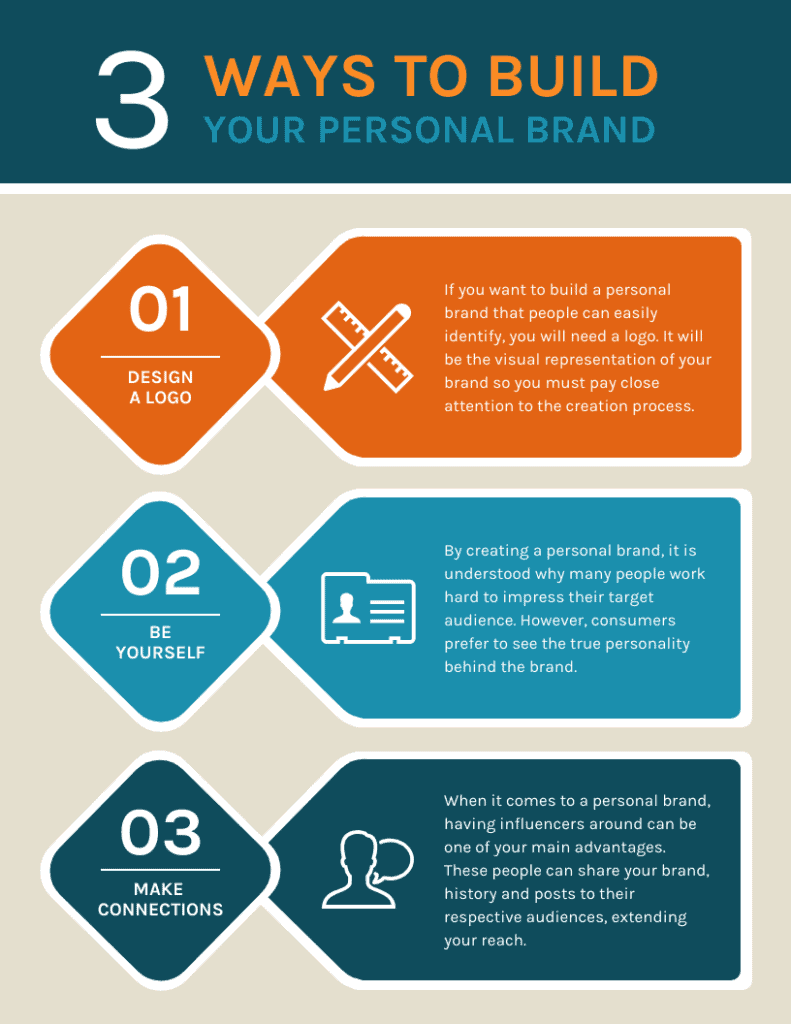
When it comes to marketing your brand, there are several things you can do to get the word out there. One excellent option is to create infographics using a free infographic maker. This can help you share information about your brand in an engaging and visually appealing way.
Table of Contents
ToggleTop 10 Benefits of using a Free Infographic Maker
1. Increased visibility for your brand.
By creating engaging infographics that showcase what your brand is all about, you can increase the awareness and visibility of your business. The more people see your infographic, the more likely they will visit your website or learn more about what you offer.
2. Greater engagement with potential customers.
An exciting and well-made infographic will likely engage potential customers more than just a standard text-based advertisement would. With so much content bombarding people online, standing out from the crowd is essential – and infographics are a great way to do that.
3. Improved SEO
You can improve your website’s SEO ranking by including keywords and phrases in your infographic title and description. This means that when people search for information on topics related to your business, they’re more likely to find your website near the top of the search results.
4. Cost-effective
Creating an infographic doesn’t have to be expensive; many free infographic makers are available online. This means you can create high-quality visuals without spending much money.
5. Increased ROI
All these benefits add up to one thing: an increased return on investment (ROI) for your branding efforts. When you use an infographic maker to create engaging visuals around your brand, you’re better positioned to see success online.
6. Monitor and compare your brand’s progress
One great thing about using an online infographic maker is that you can track and monitor your brand’s progress over time. By looking at the analytics of your infographics, you can see how many people are viewing them, how long they’re spending on each one, and where they’re coming from. This information can be precious in helping you to fine-tune your branding strategy moving forward.
7. Get creative with your content
With a free infographic maker, there are no limits to what you can create. If you have data or information that you want to share in a fun and visually appealing way, an infographic is a great option.
8. Reach a wider audience
When you share your infographics on social media or other websites, you have the potential to reach a much wider audience than you would with different types of content. This is because people are more likely to share an infographic that they found interesting or valuable, which can help increase your brand’s visibility even further.
9. Boosts credibility
If you want people to take your brand seriously, you must show that you’re an authority in your industry. Creating high-quality infographics is one way to do this, as it shows that you have valuable information to share and know how to present it in an engaging way.
10. Easily digestible content
In today’s fast-paced world, people often don’t have the time to sit down and read a long article or blog post. However, they might be more likely to spend a minute or two looking at an infographic. This makes infographics an excellent option for sharing information that you want people actually to take the time to read and understand.
How to create organized and easy-to-understand reports
A status report is a tool used by project managers to communicate the status of a project to stakeholders. The report typically includes information on the project’s current state, upcoming milestones, and any risks or issues that need to be addressed. A status report can effectively keep everyone on the same page and ensure that the project is on track.
However, creating an effective status report can be challenging. Here are some tips for creating a status report that is organized and easy to understand:
-Use a status report template: A template can help you organize your thoughts and ensure that you include all relevant information in your report.
– Be clear and concise: Avoid using jargon or technical language when writing your report. Instead, focus on communicating the critical points clearly and concisely.
– Use visuals: In addition to text, consider using visuals such as charts or graphs to illustrate essential data points. This will make your report more engaging and easier to understand.

If you’re looking for an easy way to create interesting and informative visuals about your brand or products, sign up with Venngage and try the best infographic maker today! With their wide range of templates, tools, and tutorials, you’ll be able to create beautiful visuals that will help you communicate the progress of your business in no time.
