Trading on the financial markets can be a highly technical process that requires market participants to gather and analyze vast amounts of information from an ever-changing market.
Many software providers offer enticing packages with advanced features to traders. However, many of these packages come at a hefty price tag that may be unaffordable for most traders.
User-friendly technical analysis tools help bring technical analysis to the broader market and gives access to thousands of market participants free of charge.
Tools, such as advanced charts, customizable watchlists, economic calendars, and more, allow traders to keep track of events as they unfold on the market and give them more control over their trading decisions, which leads to the formation of coherent strategies.
Advanced Charting
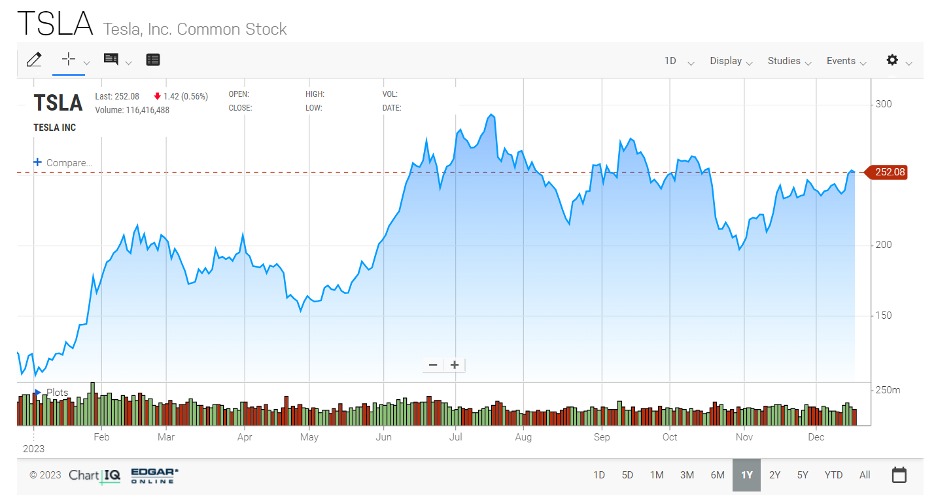
Advanced customizable charts allow traders to plot indicator lines and oscillators on a price chart to measure the volume, direction, and trend strength of price movements, which is essential in constructing profitable trading strategies.
Indicators, such as the Relative Strength Index, Stochastic Oscillator, Moving Average Convergence Divergence, etc. give traders the ability to assess price movements on a chart as they unfold, while also allowing for rough predictions regarding the future direction of the price curve.
Typically, charting tools are included in the trading platforms offered by online brokers. Additionally, traders may purchase third-party software for even more additional features and multi-layered, complex indicators.
Also Read, Benefits of Trading With an Option Chain
Customizable Watchlists
The financial markets are home to thousands of different instruments and even extensive research may only be enough to narrow down the search to a few selections.
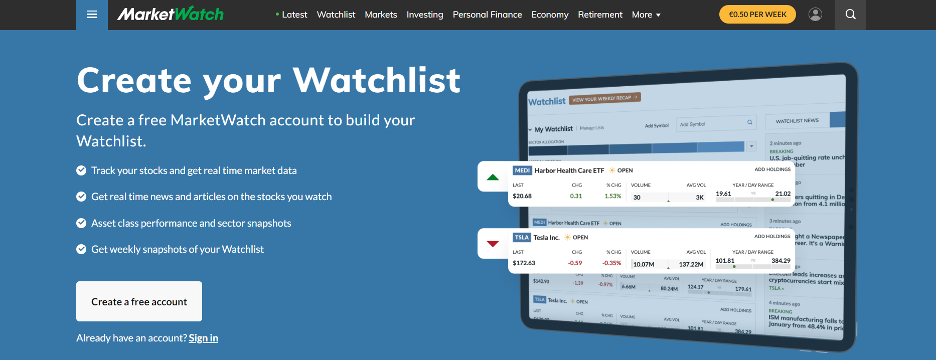
Having access to a customizable watchlist allows traders to make multiple lists of potential targets and makes the workflow more manageable.
Advanced watchlists allow traders to filter through their selection by industry, market capitalization, price, and many more key details.
Watchlists are some of the most basic features of online trading platforms and practically every brokerage, as well as third-party market data software, offer a degree of customization to their watchlists.
Backtesting
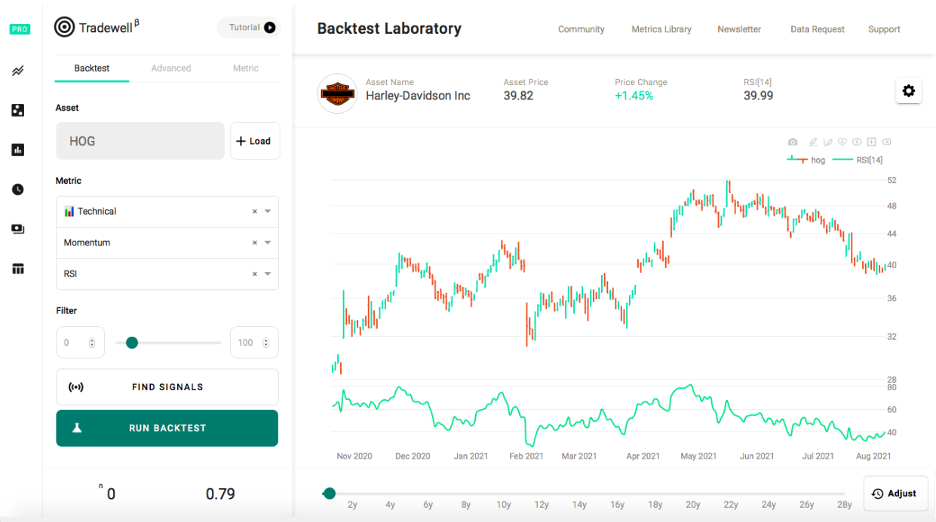
Backtesting is the process of testing the historical performance of a strategy to see how it would have performed over a set period of time.
Backtesting allows traders to see the effectiveness of a trading strategy and highlights the strengths and weaknesses that are underlying.
It is important to note that backtesting software for currency trading can be used to assess the viability of a trading strategy by applying it on major and minor currency pairs to juxtapose their performance and get a clear view of their returns.
Proper backtesting is essential in risk management and learning the ropes of backtesting strategies can help beginners have realistic expectations. The best backtesting software will allow traders to run multiple tests and compare results to clearly see if there are any issues with the results.
Backtesting entails gathering extensive data, such as open, high, low, and close prices. These data points are gathered over a specific period of time and serve as the basis for a backtest.
It is essential for the data to be accurate in order to get sufficient and accurate results from the backtest.
Economic Calendars and News Digests
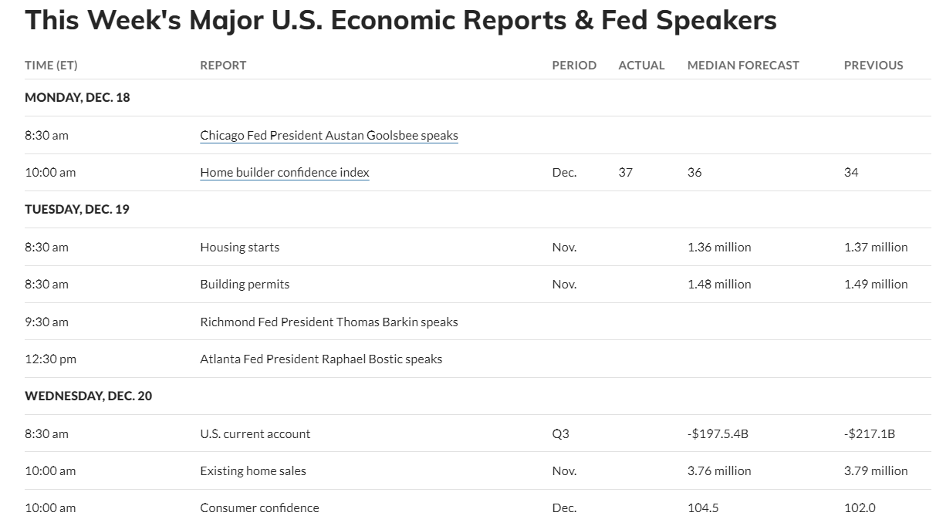
Economic calendars are simple, yet important tools that are less on the technical side. Nonetheless, these tools give traders a bird’s eye view of what is going on on the market and what important events are scheduled, as well as the markets that may be affected by the release.
An economic calendar adds functionality to your trading arsenal and allows you to keep track of market news as they unfold.
Additionally, news digests provide real-time updates from various information sources, such as major broadcast news networks, financial magazines, and more.
Forex calendars include interest rate changes and trade news, while stock trading calendars may include financial report release dates and shareholder meetings of various public companies.
Economic calendars are typically shown as dashboards on the trading platforms offered by brokers. Additionally, traders can use news widgets that can be customized in accordance to the topics of interest of the traders.
Risk Management Tools
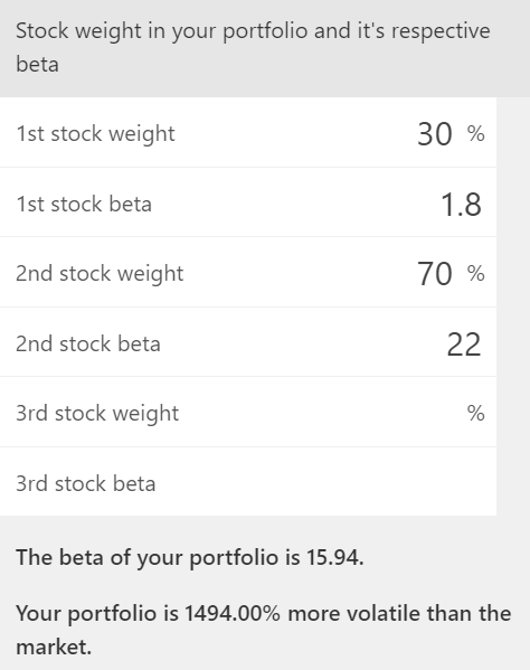
Incorporating risk management tools into your strategy can help you keep track of the overall risk exposure of your holdings and avoid unnecessary losses due to overexposure.
For example, risk management tools for stock traders can aggregate the beta coefficients of individual stocks and display an average beta for a particular portfolio. This can show traders where their portfolios may be lacking and overexposed to market risks associated with a specific industry. If a portfolio is too focused on fintech, a risk management tool will point this out and may also provide alternatives to reduce the overall exposure of the portfolio.